Monday, 20 May 2013

Fieldwork: Studland Sand Dunes

Location: East coast of the Isle of Purbeck in Dorset, nearest village is Studland, close to Poole and Bournemouth

Aim: To investigate environmental and vegetation changes across Studland Bay Sand Dunes

Hypothesis: Percentage of vegetation cover and number of plant species will increase as you move inland from the embryo dunes

Why were Studland Sand Dunes Chosen?

  • Fully developed 600 year old dune system as otherwise if it was not fully developed there would be data missing leading to inaccurate conclusions
  • They are a National Nature Reserve and a SSSI owned by the National trust so they are protected and have been able to develop with  a minimum of human interference - any changes we observe in the natural environment should be linked to natural changes in the immediate physical environment
  • The dunes are accessible at all tidal times and there is no risk of being cut off at high tide - full access to the sand dune system and kept fieldwork risks to a minimum
  • The beach can have up to 25,000 visitors on it in the summer, and as the dunes are not heavily protected or patrolled we could also observe the human impact on sand dunes
  • Very accessible as close to a B road and good parking
There are:
Embryo Dunes followed by
Grassy Dunes
Then a Heather Slack
Then a main dune ridge
Then a tree line

Fieldwork: Risk Assessment

There was a pre-visit to the dunes by staff.

We discussed possible risks in groups and as a class did a risk assessment, looking at the site on google earth to help us.

Risks:
  • Sharp Dune grass causing cuts on fingers
  • Sand blowing into eyes
  • Eating poisonous plants
  • Being cut off by high tide
  • Snake bite, more serious with a venomous bite than a dry bite
  • Verbal abuse and possible physical harm from members of the public
We assigned the risks with a Severity Score and a Likelihood score each out of 5, then used these to determine an overall risk score.

eg  Sand blowing into eyes = Likelihood score: 4   Severity Score: 1   Total risk score:   4
How we would combat this: Student briefing and carrying a first aid kit with eye wash.

Snake bite   Likelihood Score: 2    Severity Score: 4    Total Risk score: 8
How we would combat this: Student brief, wearing appropriate clothing like walking boots, checking where putting quadrat down, having mobile phones to call 999

Fieldwork: Spearman's Rank Correlation Coefficient

A simple statistical test examining the relationship between 2 sets of data.

95% significance: 0.377       99% significance: 0.534

For % of vegetation cover: +0.41 so there is a 95% certainty that it and distance from the sea are related.

For number of plant species: +0.47 so there is a 95% certainty but is more than vegetation cover

There is a moderate positive correlation.

Given that we had had 20 sites we can say with certainty that there is a 95% correlation between the variables. We can't be 99% sure.

Advantages:

  • Tells whether direction of relationship is positive or negative
  • Tells exactly the strength of the relationship unlike the scattergraph which only gives a general indication

Disadvantages:

  • Correlation does not equal causation
  • Simplistic technique
  • Need at least 10 sets of data

Fieldwork: Scattergraph

A scattergraph of distance from sea against percentage plant cover.

Dependent Variable: % of Vegetation cover
Independent variable: Distance from the sea (the one we changed)

Positives:

  • Shows the 'direction' of a relationship between 2 sets of variables through the line of best fit
  • Indicates strength of correlation by how close the points are to the line of best fit
  • Simple and visual representation of correlation
  • Shows anomalies

Negatives:

  • Have to subjectively assess the strength and correlation of the relationship
  • Individual sites are hard to identify
Ideally we would use it in conjunction with a spearmans rank.

Our results so show a positive relationship so vegetation does seem to increase but it is a fairly weak relationship as there are lots of anomalies.

Fieldwork: Improving Reliability

In order to improve the overall reliability of our results, reduce the impact of anomalies and strengthen our conclusions we could have:

  1. Repeat our experiments at another time - the environment changes throughout the year
  2. Other samples would mean a more valid conclusion
  3. We could have visited other sand dunes to compare - otherwise our conclusions are just about Studland Bay Sand Dunes and they might be anomalous
  4. Do more transects or spread them further apart to come to genuine conclusions about the sand dunes
Braunton Burrows, Devon:

would reduce the impact of anomalies and increase our results validity.

Fieldwork: Interrupted Line Transect


We did an interrupted line transect across the sand dunes every 10m.

Appropriate?

Yes

  • We were looking for changes between the sea and trees, so it was appropriate for our hypothesis.
  • If we had done random sampling all 20 sites might have been in the same place and we wouldn't have observed change with distance


Fieldwork: Systematic Sampling


We sampled slope angle, vegetation, wind speed and temperature every 10 metres.

Advantages:

  • It meant every area of the dune was sampled - we could see that trend changes with distance


Disadvantages:

  • Most of the sand dunes are missed out because we only sampled every 10m
  • We may have picked out a trend in nature - eg underlying limestone might cause chalky soils which only allow some plants to grow - This could give us a false impression
Appropriate Method?

Could have used random sampling and put numbers 1 - 200 in a hat to decide where to do our measurements.
BUT in order for it to be truly random we would have to put the numbers back, and all the places we picked out might be the same place 20 times which wouldn't give us an appropriate picture


Fieldwork: Quadrat


To assess vegetation changes we used a Quadrat. It had 25 squares (each square was 4%), and we placed it on the ground every 10 metres (systematic sampling). We estimated the total vegetation cover as well as the number of species, which was vital to our hypothesis.

Advantages:

  • Gives consistent/closed area to analyse
  • Helps estimate percentages

Problems:

  • Can crush/squash larger vegetation like marram grass
  • Percentages were a crude guess
  • Some species might have been misidentified or obscured
  • Might have missed out some vegetation that grows in clumps
  • Mights have missed out some species eg trees

Friday, 10 May 2013

Population Change in LEDCS

LEDCS tend to:

  • Have higher birth rates in Stages 1 and 2 of the demographic transition model
  • Have a steeper fall
  • Have a larger base population
  • Once they reach stage 3 the fall tends to be much steeper
  • Population change is more linked to stronger government intervention than economic benefit


Case Study: Thailand

  • National Family Planning programme since 1970
  • Advertising the benefits to a two child family
  • Establishing health care centres throughout the country
  • Public information programmes about contraception methods
  • Training parademics and midwives from local villages who are known and trusted


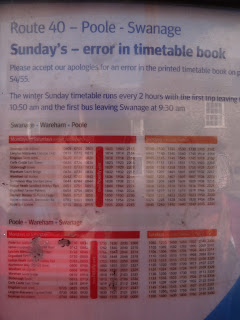
Case Study: Corfe Castle Services


Friday, 3 May 2013

Case Study: British American Tobacco

Our goals are to grow our brands and the value of the business, to improve productivity and to embed the principles of corporate responsibility around the Group
Brands They Produce: Dunhill, Kent, Lucky Strike, Pall Mall, Bensons & Hedges etc

They have the dominant market share in: Canada, Australia, Brazil, South Africa, Pakistan, Norway and many more.


Manufacturing:

  • HQ in London
  • R&D in Southampton and Cambridge (university towns)
  • 52 Factories worldwide, plus 4 specific cigar factories

Tobacco Leaf Sourcing: 

  • Purchase 460,000 tonnes of tobacco leaves
  • 80% of the tobacco leaves are from emerging countries
  • The supply chain is made up of around 250,000 farmers
  • Tobacco leaves are produced under a 'Social Responsibilty in tobacco production programme

Global Brands Drive:

  • Trying not to be reliant on just USA and Western Europe as while there are high profit margins there is a decline in sales volume
  • Trying to break into emerging economies where volumes are set to rise like Indonesia, where lots of cheap tobacco is sold until a lot of people are addicted

An ethical approach means that shareholders, consumers and producers are happy. BUT there are some issues...

Developing Economies and Tobacco:

  • Largest agribusiness in Kenya, contracting over 17,000 farmers who work on 15,000 hectares.
  • In these regions food production had dropped dramatically
  • The danger is that tobacco cultivation will replace food crops
  • Tobacco sourced from the devloping world tends to be used to make less expensive brands - cigarrettes made from tobacco grown in Brazil cost half of ones with American tobacco
Developing economies and tobacco: 
  • Shift in production to LEDCs because of their lower labour costs, with many factories in South East Asia
  • Factories in places like Singapore and Kores are closer to destination markets
  • Closure of UK factories like one in Southampton
Marketing and Tobacco:
  • Harder to advertise cigarrettes in MEDCs due to advertising bans
  • Iincreased activity in NIC and LEDC markets as oppose to MEDCs, where it is declining in part due to health/social issues
BAT in India:

  • It is an emerging market
  • Around 5 million children under the age of 15 are addicted to tobacco
  • BAT are actively advertising to convert people, particularly the young, to cigarettes eg branded pop concerts, free samples
  • TNCs can now own factories outright in India


http://www.bat.com/

Tobacco TNCs

Brands: Camels, Malboro, Prince, More, Mayfair
TNCs: Phillip Morris International, China National Tobacco, Japan Tobacco International

(Not so fun) Facts:

  • 5 trillion cigarettes are produced per year globally
  • Tobacco is smoked by over 1 billion customers around the world every day
  • Around 6 million people die globally each year from smoking
  • Globally there are between 8,00 to 14,000 cigarettes produced every minute

CHINA:
China is the biggest market with 350 million smokers consuming 1800 billion cigarettes each year.

It accounts for 35% of the global market.

70% of chinese men smoke, but only 4% of women.

The industry in China is owned by the State.

The Chinese National Tobacco Company was worth $91.7 billion in 2010.

The Health Risks of Smoking:

  • Heart attacks and strokes - Smokers are 5x more likely to have a heart attack than non smokers
  • Cancer - Oral, throat, lung, cervical
  • Other lung problems like Emphysema