Tuesday 25 March 2014

Risk of erosion

It's a global phenomenon 
  • Damages areas where runoff ends up
  • degrades land that is eroded
  • reduces crop yields
  • eroded soil damages dams, rivers, lakes, buildings and roads
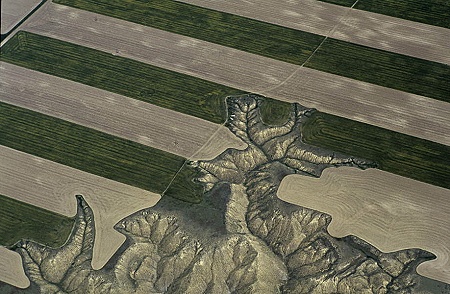
  • Occurs particularly on steeper slopes, on eroidable soils under crops vulnerable to erosion and where unwise farming methods are practised
  • In uplands caused by overgrazing and footpaths
Very High Risk:
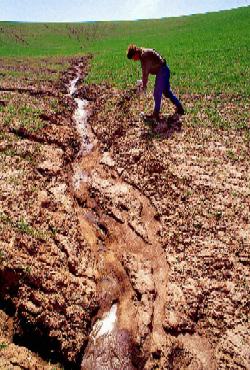
Rills likely to form in most years and gullies may develop in very wet periods

High Risk:
Rills are likely to develop in most seasons during wet periods

Moderate:
Sediment may be seen running to roads, ditches or watercourses
Rills may develop in some seasons during very wet periods

Lower:
Sediment is rarely seen to move but polluting runoff may enter ditches or watercourses


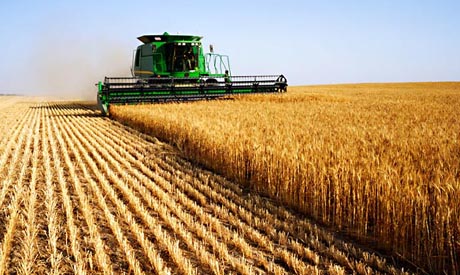
Crops' susceptibility to erosion:

High: Winter cereals, potatoes, maize, sugar beet
Moderate: Winter forage crops eg turnips, oil-seed rape
Low: Permanent grass, woodland

Submergent Fettures: Rias

A Ria is an irregular coastal inlet caused by a relative rise in sea levels resulting in the submergence of a former valley system.


Types of Ecosystems

from the Millenium Ecosystem Assessment reporting catergories

Marine - Ocean deeper than 50m

Coastal - Interface between ocean and land

Inland Water - Permanent water bodies and areas dominated by regular flooding that are inland from the coast


Forest - Land that is at least 40% covered by woody plants taller than 5m
Rainforest Wallpaper

Dryland - Land where annual precipitation is less than two thirds of potential evaporation
File:Kenya scrubland.jpg

Islands -Land surrounded by water with a high proportion of coast to hinterland

Mountains - Land surrounded by water and with a high proportion of coast to hinterland

Polar - High Latitude systems frozen for most of the year


Cultivated - Land dominated by agriculture including orchards or forestry

Urban - Built environments with high human density and population of 5000 or more

Case Study: Mount St Helens

Reasons for growth in Volcanic Tourism industry:
  • Improvements in air travel made places like Hawaii more accessible
  • Global media coverage has increased public awareness of these events
  • World Heritage sites raise profile of places like Giant's causeway
Mt St Helens:
  • Strato volcano in Cascade mountain range
  • Before 1980 it attracted people to hunt, ski and hike
  • Spirit Lake at its base was popular area for fishing, boating and swimming
  • Forests were commercially logged
  • 1980 people flocked to see eruption
  • Vechicles blocked road to spirit lake
  • Souvenir trade: ash in glass vials, tshirts, mugs
  • Forestry service sought safe spots where people could view eruption
  • Mobile trailers set up to show film footage
  • More violent than predicted
  • Claimed 57 lives


Recovery:

Economic:
  • Spirit Lake Memorial Highway
  • Large bridges
  • Five visitor centres
Social:
  • Mt St Helens Volcanic Monument established
Environmental:
  • Several interpretative trails
  • sediment retention structure
  • Pumice plain receeded
  • Outlets cut to release water from lakes created when avalanches dammed streams to decrease flood risk
  • Tunnel constructed at Spirit Lake to maintain safe water level
Tourism Issues:
Conservation: 
  • Only one road leads to site
    • pressure on observatory
    • other attractions help
  • Erosion - hardened park area with 420 vehicle capacity
  • Destruction by vistors
    • trampling can damage pioneer speicies
    • $100 fine for stepping on or picking wildflowers

Monday 20 May 2013

Fieldwork: Studland Sand Dunes

Location: East coast of the Isle of Purbeck in Dorset, nearest village is Studland, close to Poole and Bournemouth

Aim: To investigate environmental and vegetation changes across Studland Bay Sand Dunes

Hypothesis: Percentage of vegetation cover and number of plant species will increase as you move inland from the embryo dunes

Why were Studland Sand Dunes Chosen?

  • Fully developed 600 year old dune system as otherwise if it was not fully developed there would be data missing leading to inaccurate conclusions
  • They are a National Nature Reserve and a SSSI owned by the National trust so they are protected and have been able to develop with  a minimum of human interference - any changes we observe in the natural environment should be linked to natural changes in the immediate physical environment
  • The dunes are accessible at all tidal times and there is no risk of being cut off at high tide - full access to the sand dune system and kept fieldwork risks to a minimum
  • The beach can have up to 25,000 visitors on it in the summer, and as the dunes are not heavily protected or patrolled we could also observe the human impact on sand dunes
  • Very accessible as close to a B road and good parking
There are:
Embryo Dunes followed by
Grassy Dunes
Then a Heather Slack
Then a main dune ridge
Then a tree line

Fieldwork: Risk Assessment

There was a pre-visit to the dunes by staff.

We discussed possible risks in groups and as a class did a risk assessment, looking at the site on google earth to help us.

Risks:
  • Sharp Dune grass causing cuts on fingers
  • Sand blowing into eyes
  • Eating poisonous plants
  • Being cut off by high tide
  • Snake bite, more serious with a venomous bite than a dry bite
  • Verbal abuse and possible physical harm from members of the public
We assigned the risks with a Severity Score and a Likelihood score each out of 5, then used these to determine an overall risk score.

eg  Sand blowing into eyes = Likelihood score: 4   Severity Score: 1   Total risk score:   4
How we would combat this: Student briefing and carrying a first aid kit with eye wash.

Snake bite   Likelihood Score: 2    Severity Score: 4    Total Risk score: 8
How we would combat this: Student brief, wearing appropriate clothing like walking boots, checking where putting quadrat down, having mobile phones to call 999

Fieldwork: Spearman's Rank Correlation Coefficient

A simple statistical test examining the relationship between 2 sets of data.

95% significance: 0.377       99% significance: 0.534

For % of vegetation cover: +0.41 so there is a 95% certainty that it and distance from the sea are related.

For number of plant species: +0.47 so there is a 95% certainty but is more than vegetation cover

There is a moderate positive correlation.

Given that we had had 20 sites we can say with certainty that there is a 95% correlation between the variables. We can't be 99% sure.

Advantages:

  • Tells whether direction of relationship is positive or negative
  • Tells exactly the strength of the relationship unlike the scattergraph which only gives a general indication

Disadvantages:

  • Correlation does not equal causation
  • Simplistic technique
  • Need at least 10 sets of data